Info
Rewind comparisons are only available on larger screens.
compare
Daily activities
1 activities in 2016
Daily activities
317 activities in 2024
Gear
Total hours spent per gear
Gear
Total hours spent per gear
Longest activity (h)
Lauf am Nachmittag
Distance
40.93km
Elevation
1 240m
Time
7.6hrs
Longest activity (h)
GR20 Tag 1
Distance
21.96km
Elevation
2 301m
Time
9hrs
Distance
Total distance per month
40
km
Distance
Total distance per month
5 492
km
Moving time
Total moving time per month
8
hours
Moving time
Total moving time per month
414
hours
Elevation
Total elevation per month
1 240
m
Elevation
Total elevation per month
49 097
m
Moving time by sport
Total hours spent per sport type
8
hours
Moving time by sport
Total hours spent per sport type
414
hours
Streaks
Longest streaks
1
days
1
weeks
1
months
Longest streak 03-09-2016
Streaks
Longest streaks
31
days
53
weeks
12
months
Longest streak 01-12-2024 - 31-12-2024
Rest days
Rest days vs. active days
0
%
Rest days
Rest days vs. active days
69
%
Start times
Activity start times
Start times
Activity start times
Activity count
Number of activities per month
1
activities
Activity count
Number of activities per month
317
activities
Carbon saved
Reduced carbon emission by commuting
0
kg CO₂
0.00
kg CO₂
0
PET bottles produced
0
Google searches
Carbon saved
Reduced carbon emission by commuting
52
kg CO₂
52.37
kg CO₂
782
PET bottles produced
261 861
Google searches
Group activities
You weren't alone out there
0
activities
0%
of your activities
0
With others
1
On your own
Group activities
You weren't alone out there
45
activities
14%
of your activities
45
With others
272
On your own
Calories burnt
Energy burned across your activities
0
kcal
0
kcal
0
Pizza slices
0
Bananas
Calories burnt
Energy burned across your activities
277 341
kcal
277 341
kcal
1 027
Pizza slices
2 641
Bananas
Activity locations
Locations over the globe
No data available
Activity locations
Locations over the globe
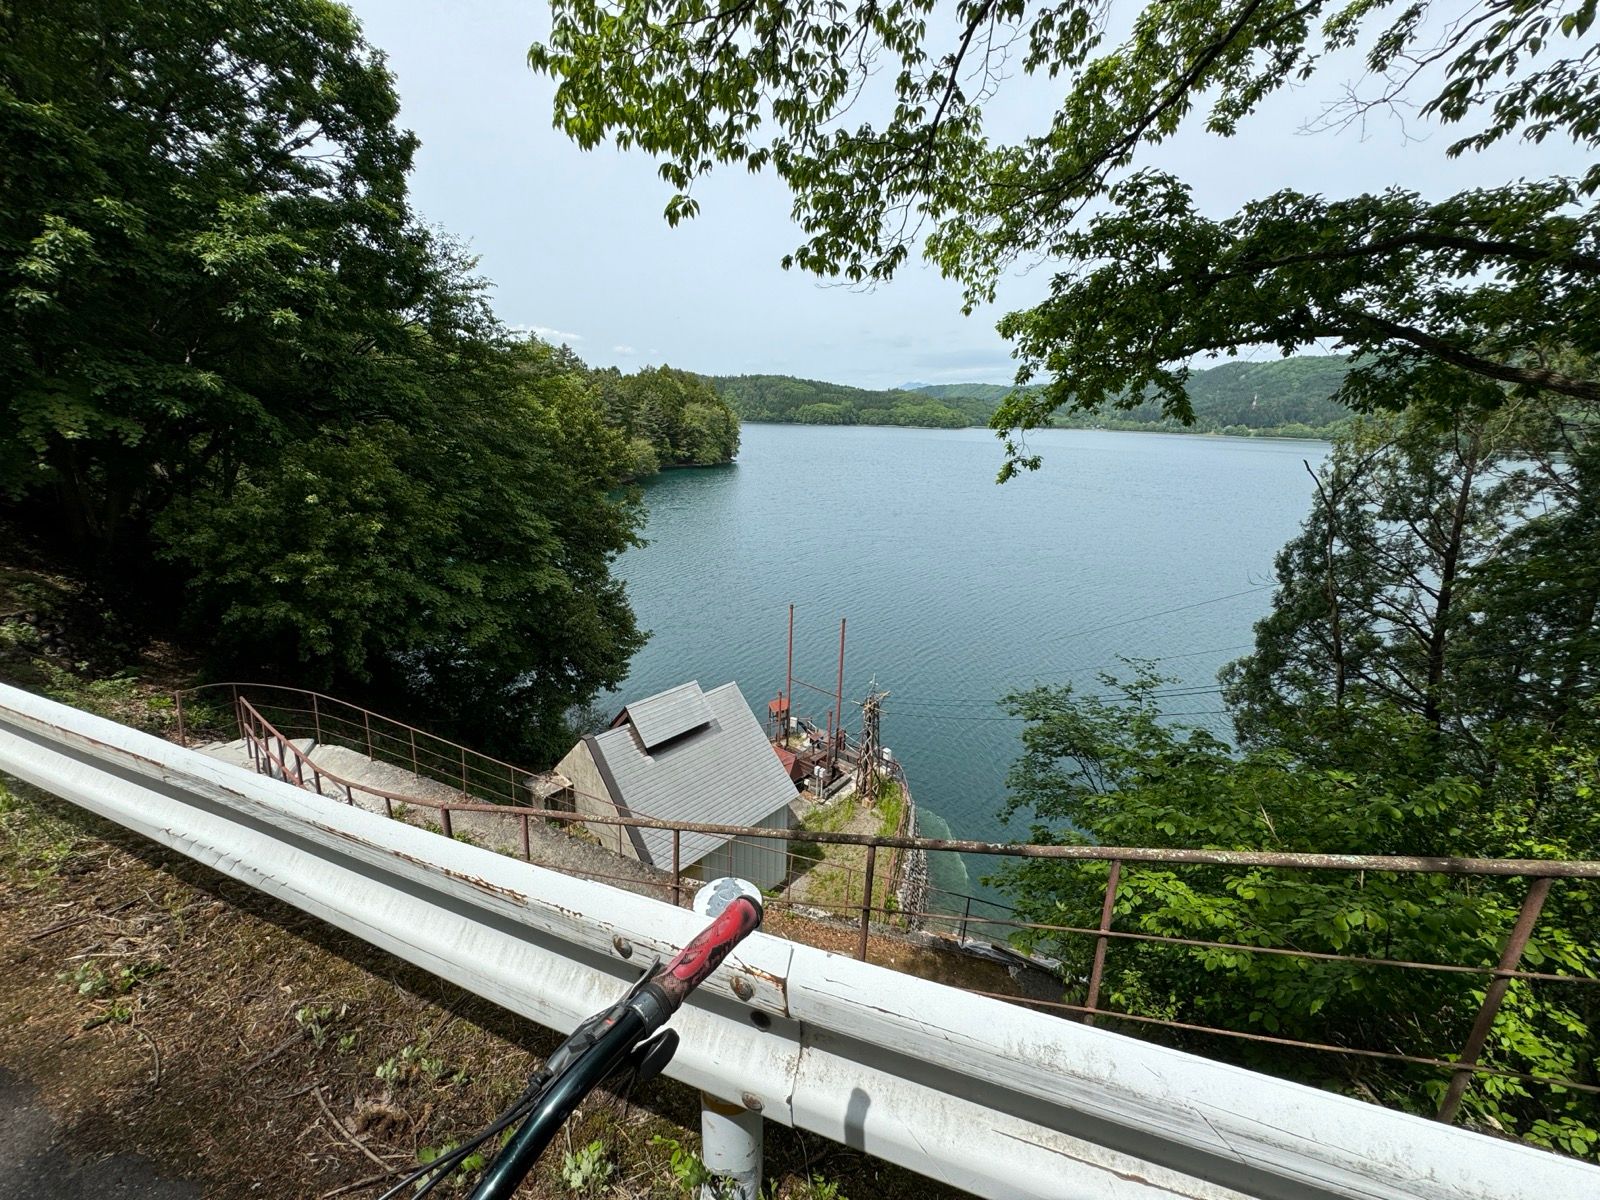
Photo
No data available
Photo
May 26, 2024
These charts are based on Kai's work, go check it out